Materials, when subjected to a temperature variation, can exhibit changes in their chemical and physical structure, such as phase transitions or degradation processes. These internal changes in the material can be accompanied by an absorption or release of heat.
Differential Scanning Calorimetry (DSC) is an experimental technique that monitors the heat flow between a sample and a reference, which are subjected to a controlled temperature profile (heating, cooling, or isothermal), under identical conditions and in the same furnace. Any temperature difference between the sample and the reference leads to a heat flow that is proportional to the difference in their heat capacities.
This technique is very useful for determining phase transitions, such as melting, crystallisation, or chemical reactions, and therefore also provides information on the percentage of amorphous and crystalline structure in a material, and its degree of polymerisation or cross-linking.
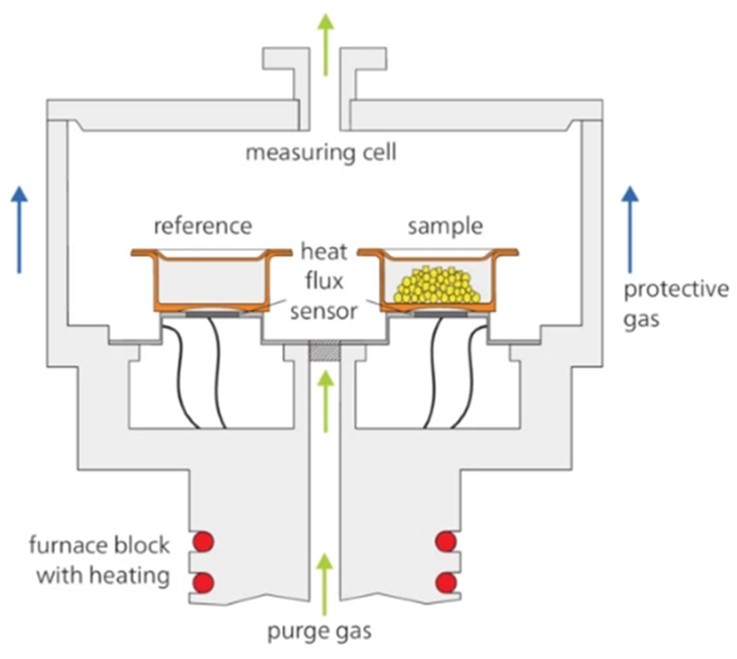
The instrument consists of a furnace that can house the sample and the reference, allowing heating to high temperatures (up to 600°C). It is also equipped with a control system for managing the temperature programmes, a sensor for measuring the heat flow, and a ventilation system, which maintains a controlled atmosphere inside the furnace (see Fig. 1).
Typical scan rates range from 1 to 20°C/min, and the sample mass is often in the order of 5-20 mg.
The atmosphere can be inert (N2) or oxidising (air) to distinguish physical processes from thermo-oxidative reactions. Calibration with standards (e.g., indium, tin) and baseline correction are essential for accurate measurements.
DSC graph example
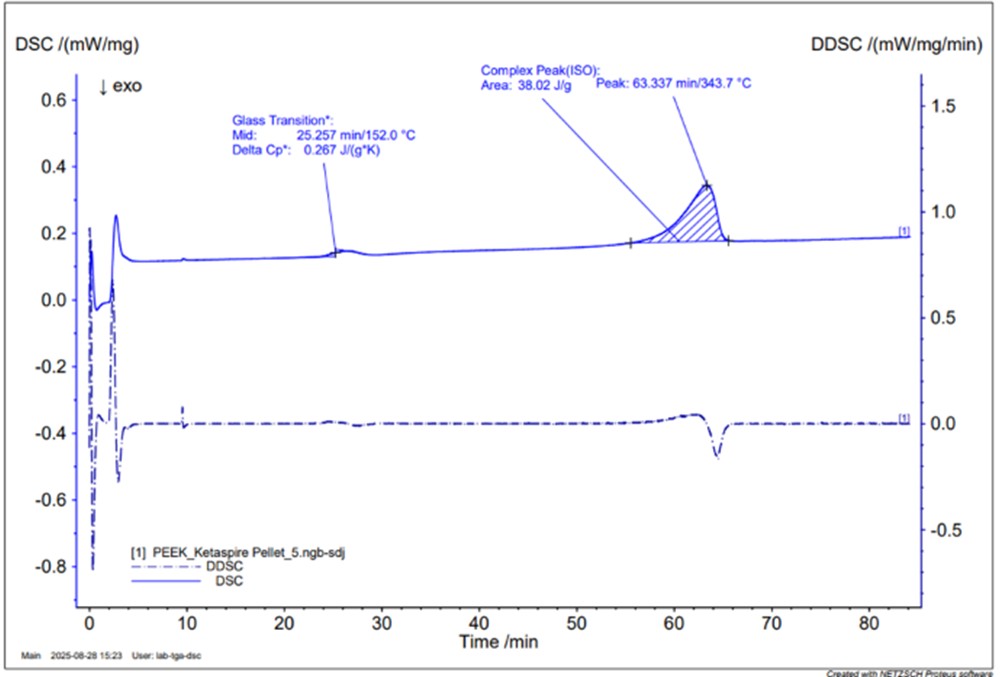
The graph shows the behaviour of PEEK, a thermoplastic material, subjected to heating.
Observing the solid blue curve, two peaks related to heat absorption, also known as endothermic peaks, can be identified. From the position of the first peak, the glass transition temperature (Tg) can be derived, which corresponds to 152°C. From the second peak, we can determine the melting temperature (Tm), which corresponds to 343.7°C and, by measuring the area underneath, we can calculate the percentage of crystallinity of the material, equal to 29.25%.